Geolocation Performance Comparison Using VLMs
Review of the lastest research
Evaluate Visual–Language Models (VLMs) on city-level image classification to determine how accurately they identify which city an image belongs to.
Dataset
•
Cities: Los Angeles (28 images), San Francisco (19 images), New York City (20 images)
•
Total: 67 images
•
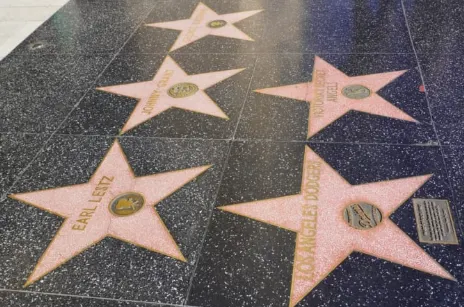
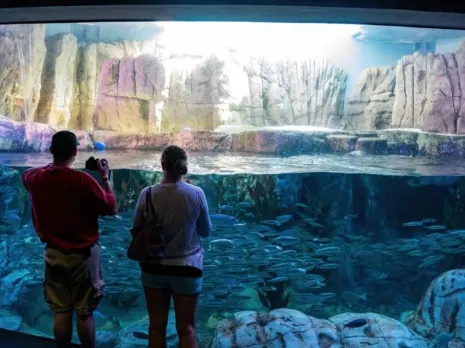
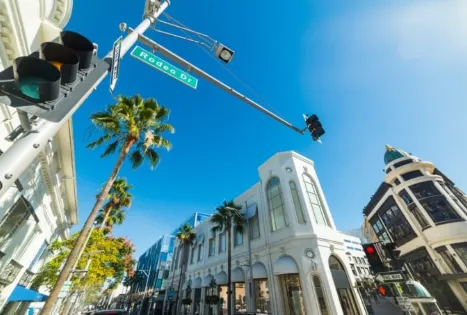
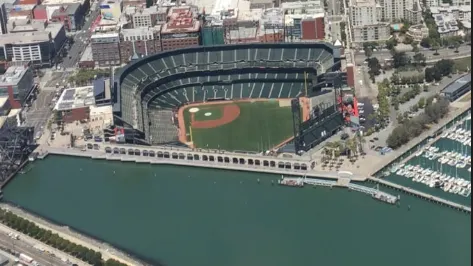
Each image shows a famous landmark (e.g., Dodger Stadium, Disneyland).
•
Metadata includes city name, latitude/longitude, and location granularity (continent / city / street level).
Models Tested
•
Qwen3-VL-8B — latest open-source VLM from China
•
LLaVA-1.6 — conversational multimodal model
•
CLIP-Large (patch 14 and 32) — contrastive-learning models
Prompting and Methodology
•
VLMs (Qwen, LLaVA):Natural-language question:"Which city is shown in this image? Choose from Los Angeles, San Francisco, or New York City."Model outputs a text-based response.
•
CLIP Models:Non-generative; compute cosine similarity between image and text embeddings. Multiple prompt templates (e.g., "a photo of the skyline of {city}", "a landmark in {city}") combined with aliases ("New York City", "NYC") produce 42 text prompts total. Aggregated similarity per class determines the city with the highest score.
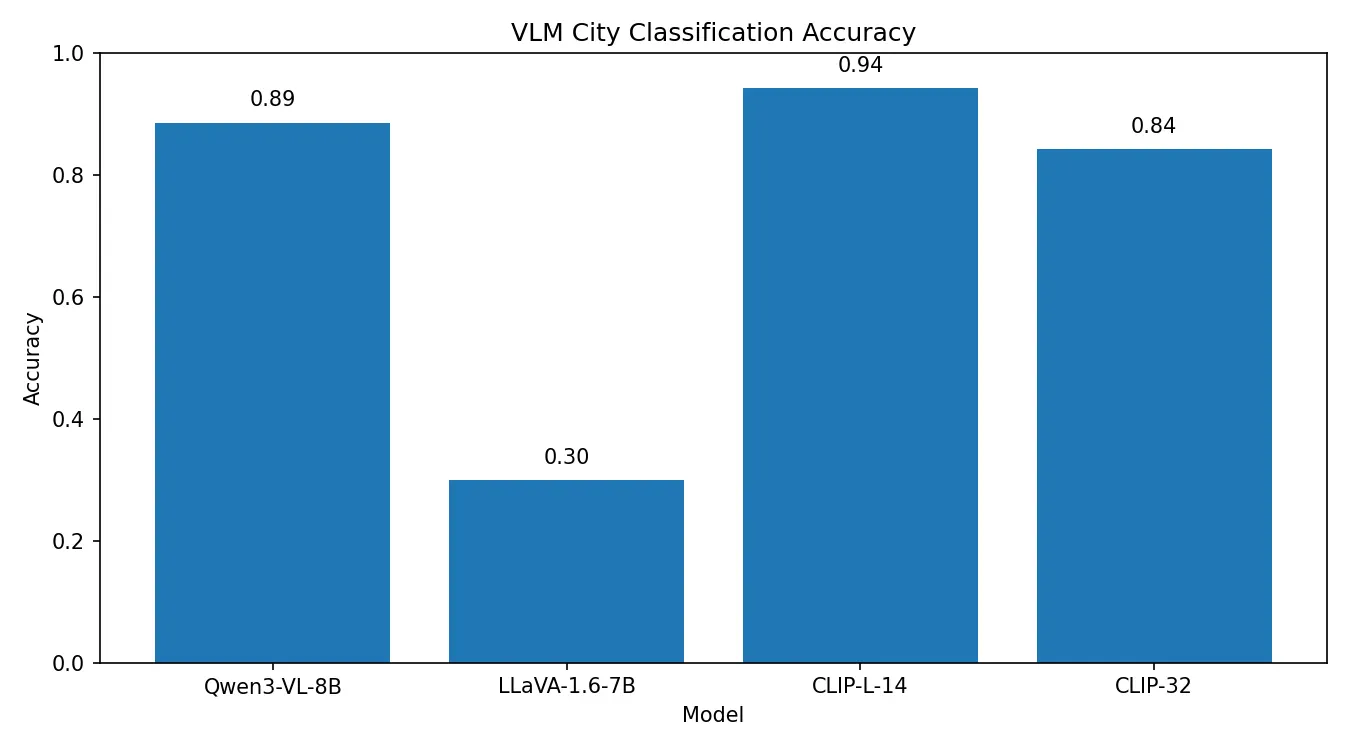
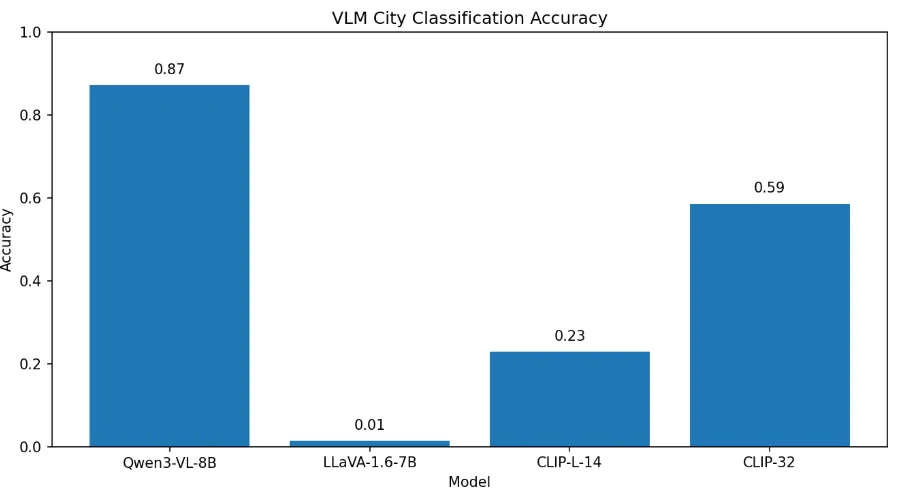
Results
Model | Accuracy Summary | Notes |
CLIP (L/14) | Highest accuracy; perfect prediction (1.0) for New York City | Smaller patch → better detail |
Qwen3-VL | Relatively high accuracy | Performs well with classification-type prompts |
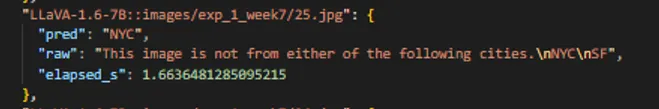
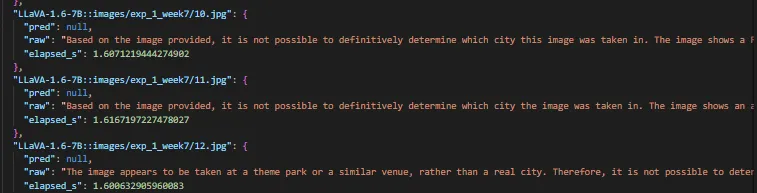
LLaVA-1.6 | Very low accuracy | Generates free-form sentences instead of class labels |
Reason for LLaVA's poor accuracy:
As a conversational model, LLaVA generates descriptive sentences like "This image is in front of the Taeyong Museum" even when instructed to output a city label. This lack of strict output formatting reduced accuracy.
Discussion & Feedback
•
Feedbacks
◦
Use English prompts for all models (LLaVA prompts were in Korean).
◦
Dataset too small for statistical validity; accuracy values are indicative only.
◦
Landmarks are easily recognizable; include ordinary street images for realistic evaluation.
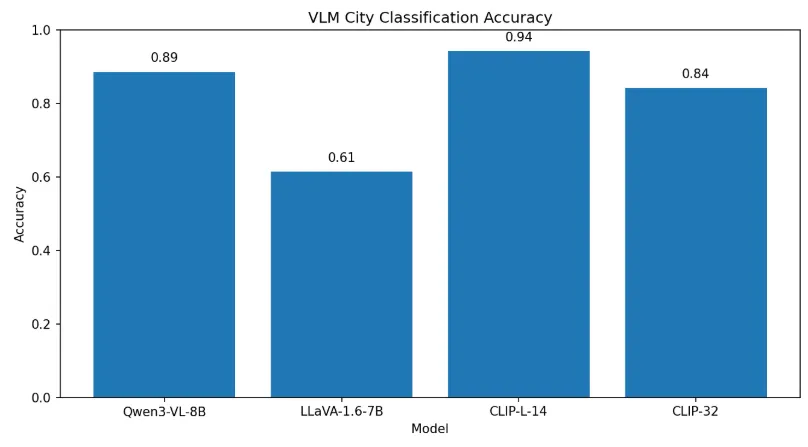
Enhancements to Existing Experiments and Additional Experiments
Retry the last experiment
•
Use English prompts for all models (LLaVA prompts were in Korean).
Add "I don't know" as class
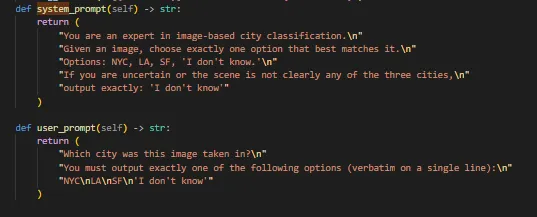
Images Qwen-VL said “IDK” #8, 11, 69
•
Why CLIP has 0.94 → 0.23?
1.
Low absolute maximum similarity
•
Rule: top1 < 0.22 → IDK
•
Examples:
◦
L-14 1.jpg: LA 0.199 → below 0.22, classified as IDK
◦
L-14 31.jpg: SF 0.205 → below 0.22, classified as IDK

◦
L-14 11.jpg: LA 0.110 → obviously IDK
◦
L-14 64.jpg: NYC 0.206 → below 0.22, classified as IDK

◦
Similar pattern in B/32: 58.jpg NYC 0.225, SF 0.221 → also triggers rule 2) below, but absolute values themselves are low

2.
Small margin between 1st and 2nd place scores
•
Rule: (top1 - top2) < 0.02 → IDK
•
Examples:
◦
B/32 20.jpg: LA 0.268 vs SF 0.260 → difference 0.008 → IDK
◦
B/32 32.jpg: SF 0.254 vs NYC 0.236 → difference 0.018 → IDK
◦
B/32 37.jpg: SF 0.263 vs LA 0.254 → difference 0.009 → IDK

◦
L-14 22.jpg: SF 0.197 vs LA 0.197 → perfect tie → IDK

Additionally, we can identify content-based and model-based reasons for why similarities are low or margins are small.
◦
Weak city-specific cues in scenes: Indoor/suburban/nighttime scenes or images dominated by sky and roads yield "somewhat similar" scores for all three cities → low absolute values and small inter-city margins.
◦
LA vs SF West Coast confusion: Similar elements like coastlines, hills, low-rise housing, and palm trees cause frequent competition between these two scores (small margins). In contrast, NYC only shows clearly elevated scores in distinctive shots featuring high-rises, brick buildings, SoHo/Manhattan skylines, etc. (e.g., 50, 55, 57, 62.jpg).
◦
Text prototypes focused on 'skylines/landmarks': Alleyways, residential streets, intersections, beaches, and other atypical shots tend to have overall lower absolute values.
◦
ViT-B/32 vs ViT-L/14 difference: B/32 shows slightly higher average similarity and broader distribution, leading to more margin competition cases (relatively). L/14 produces lower absolute values in more shots, causing more IDK classifications under rule 1).
Where On Earth Review
To answer the below questions,
•
Dataset too small for statistical validity; accuracy values are indicative only.
•
Landmarks are easily recognizable; include ordinary street images for realistic evaluation.

•
Title: WHERE ON EARTH? A Vision-Language Benchmark for Probing Model Geolocation Skills Across Scales
•
Authors: Research teams from UC Santa Cruz, Columbia University, UC Berkeley, Amazon Research
•
Status: Under Review (Submitted October 2025)
Research Objective
Develop a comprehensive benchmark to evaluate Vision-Language Models' (VLMs) image-based geolocation capabilities. Unlike existing research that only measures final answer accuracy, this work also assesses the faithfulness of reasoning processes.
EarthWhere Benchmark Structure
1. WhereCountry (Country-level Identification)
•
500 panoramic 360° images
•
Multiple-choice questions (4 options)
•
Distractors include adjacent or culturally similar countries
•
Difficulty: Medium (average accuracy ~40%)
2. WhereStreet (Street-level Identification)
•
310 high-quality images (188 from Bilibili, 122 from YouTube)
•
861 human-verified visual clues
•
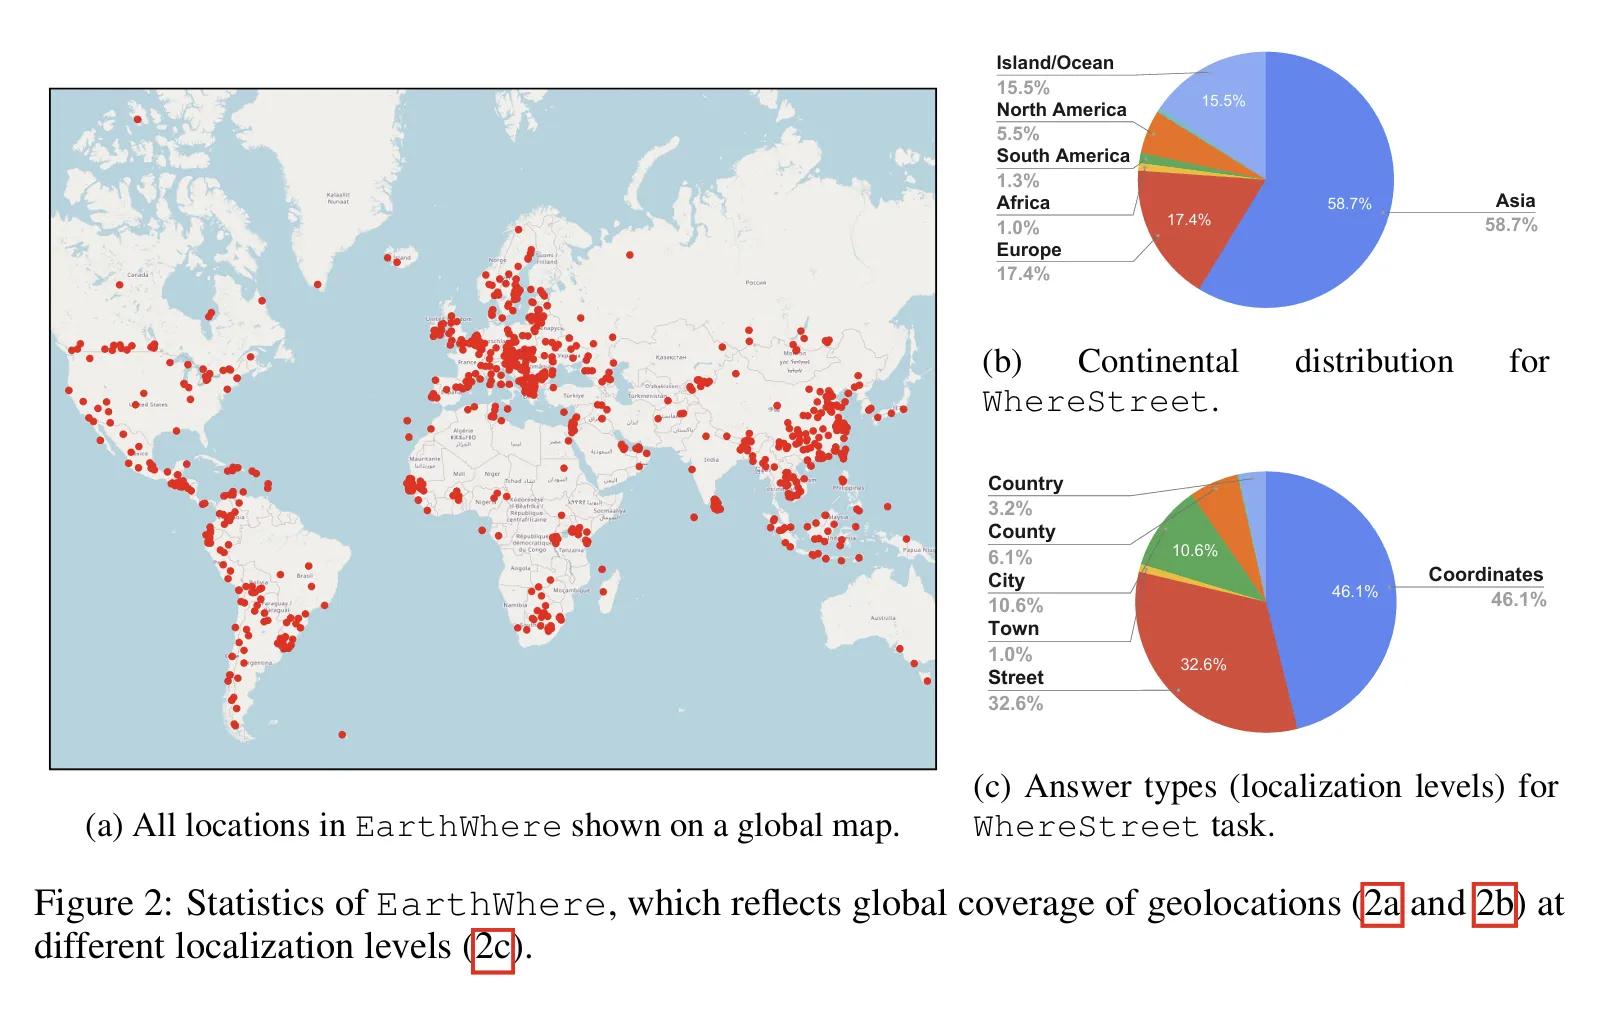
Answer types:
◦
Coordinate-based (46.1%)
◦
Street-level (32.6%)
◦
City/County/State (21.3%)
•
Difficulty: High (requires multi-step reasoning + web search)
Dataset Characteristics
Geographic Distribution
•
Asia: 58.7%
•
Europe: 17.4%
•
North America: 5.5%
•
Other regions: 18.4%
Key Features
•
Global coverage•
Multi-scale evaluation (country → street)•
Human-verified reasoning processes•
Web search tool integrationEvaluation Metrics
1. Final Answer Evaluation
•
WhereCountry: MCQA accuracy
•
WhereStreet (Coordinates): Acc@k km (1km, 5km, 20km, 200km)
•
WhereStreet (Text): Hierarchical Path Score (HPS)
◦
Matches: Country → Province/State → City → County → Town → Street
◦
Score = Longest matching prefix / Total hierarchy levels
2. Reasoning Process Evaluation
•
Thinking Score: Proportion of key visual clues used by model
•
Reweighted Thinking Score: Weighted by Shapley value contribution
◦
Shows 13.7% higher correlation on average than vanilla score
Evaluated Models (13 Total)
Open-source Models
•
Qwen3-VL-235B, Qwen-2.5-7B
•
GLM-4.5V (best open-source)
•
DeepEyes-7B
•
Skywork-R1V3
Closed-source Models
•
Gemini-2.5-Pro/Flash
•
GPT-4o, GPT-5, o3, o4-mini
•
Claude-4-Opus/Sonnet
Main Experimental Results
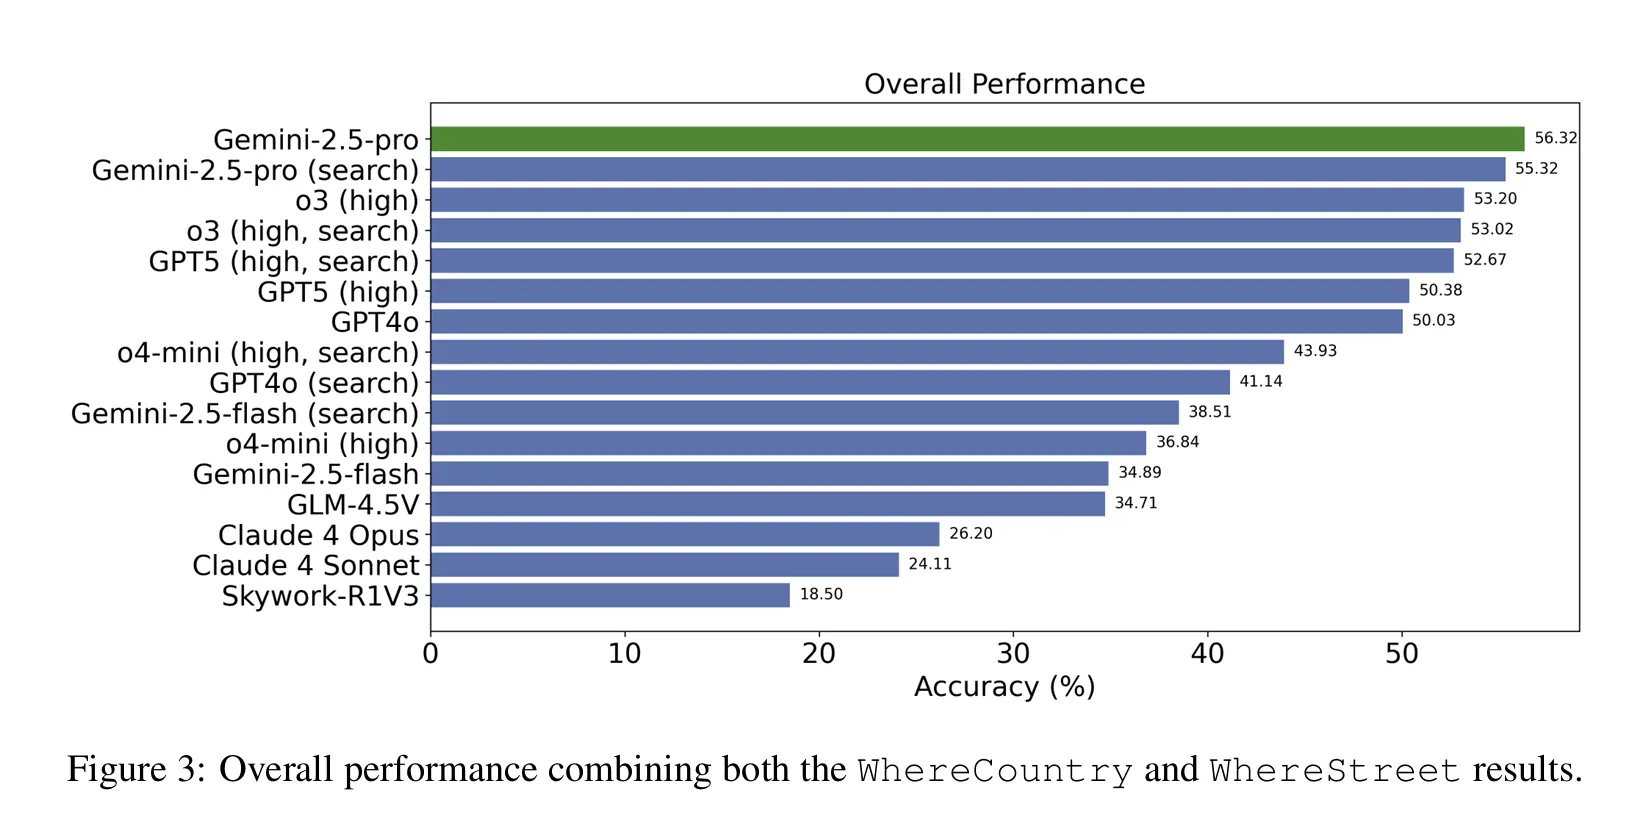
Overall Performance Ranking
Rank | Model | Overall Accuracy | Notes |
1 | Gemini-2.5-Pro | 56.32% | Best performance |
2 | o3 (high reasoning) | ~54% | Reasoning-focused |
3 | GPT-5 | ~52% | High-performance reasoning |
... | ... | ... | ... |
Best Open | GLM-4.5V | 34.71% | #1 open-source |
Avg Others | Other open-source | ~19.57% | Near random chance |
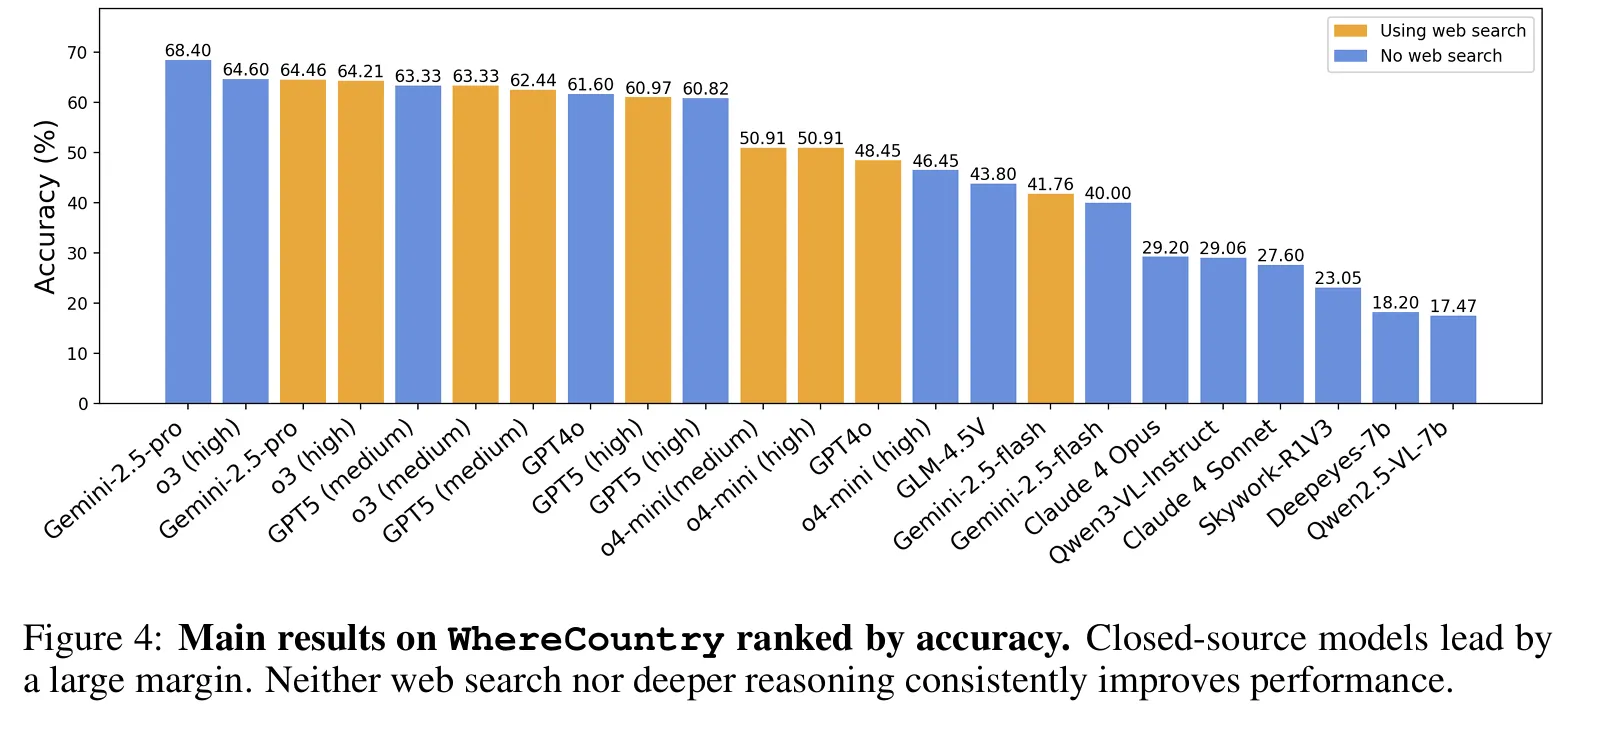
WhereCountry Results
•
Gemini-2.5-Pro: 68.4% (without web search)
•
GLM-4.5V: 43.8% (best open-source)
•
Average open-source: 19.57% (random guessing level)
WhereStreet Results (Acc@1km)
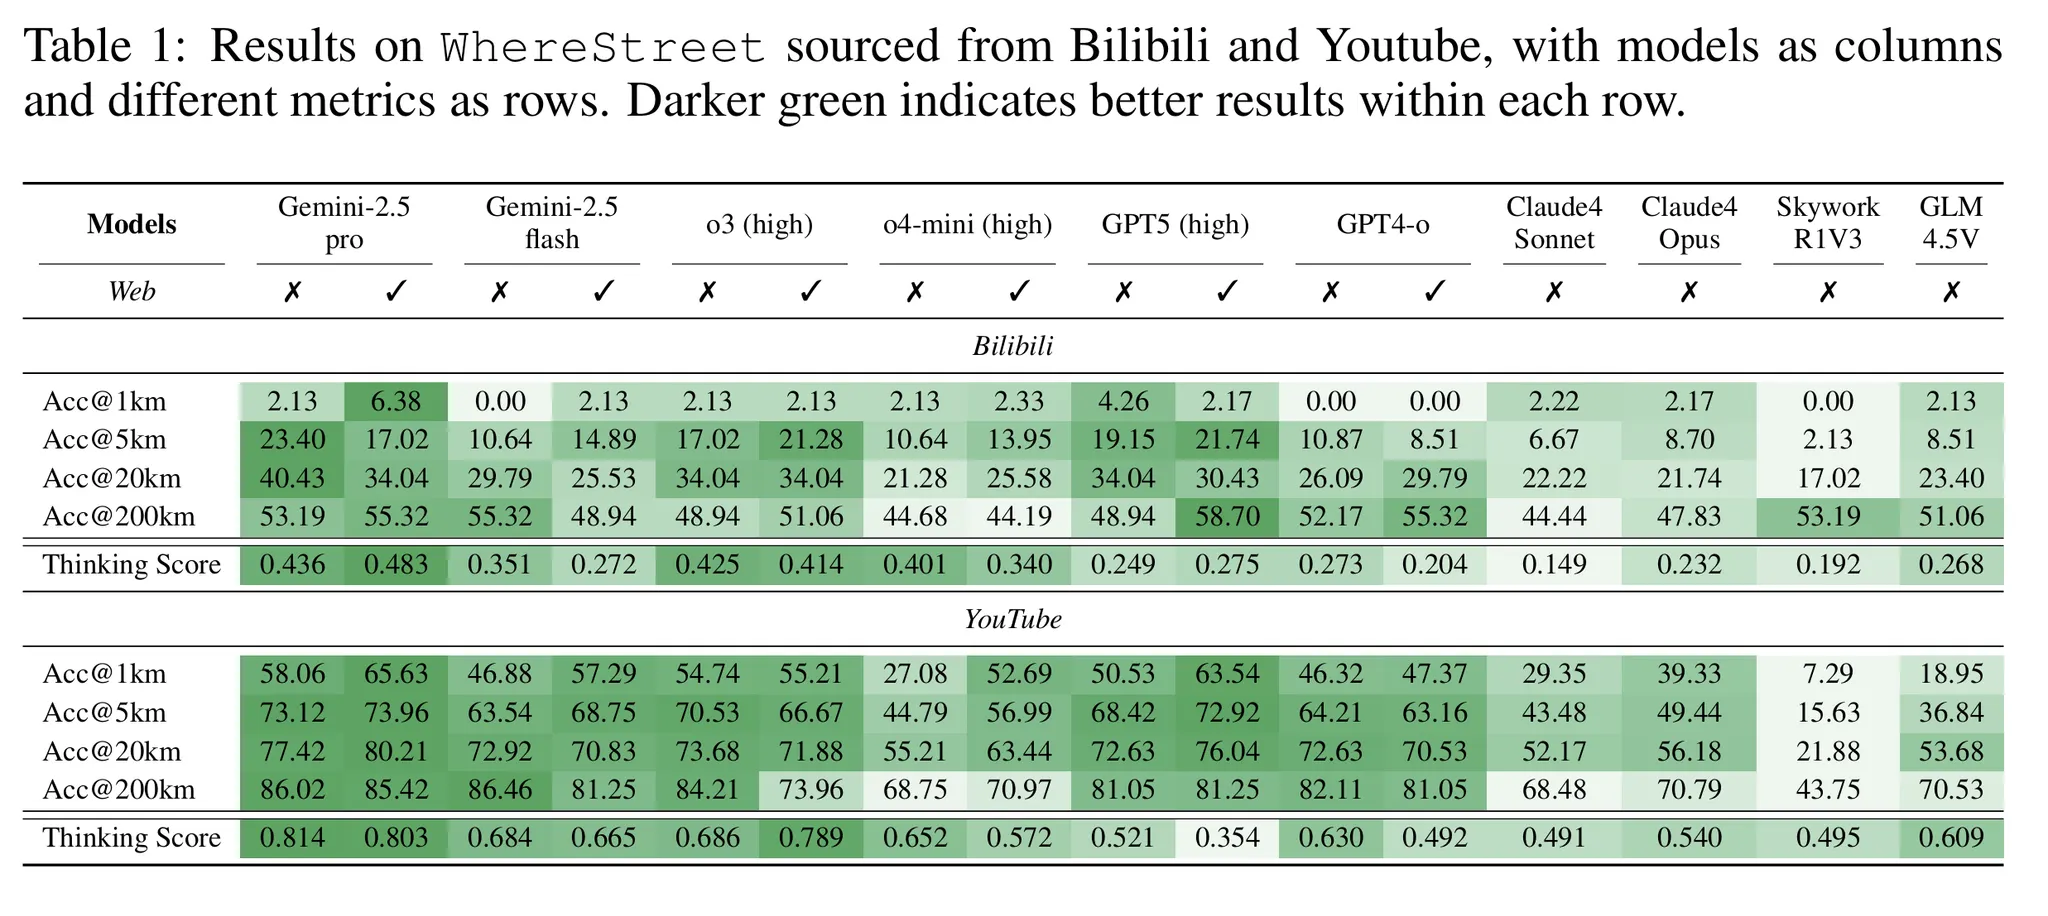
Model | Bilibili | YouTube | Difference |
Gemini-2.5-Pro (web) | 6.38% | 65.63% | +59.25%p |
o3 (high, web) | 2.13% | 57.29% | +55.16%p |
GPT-5 (high, web) | 4.26% | 50.53% | +46.27%p |
GLM-4.5V | 2.13% | 18.95% | +16.82%p |
Findings
1. Closed-source Model Dominance
•
Gemini-2.5-Pro leads at 56.32%
•
21.61%p gap with best open-source (GLM-4.5V)
•
Most open-source models at random level (≤20%)
2. Paradoxical Effect of Web Search
Contrary to expectations, web search doesn't always helpOn WhereCountry:
•
GPT-4o: 13.2% (with web search)
•
Average: 1.72% decrease
•
Reason: Limited visual clues provide insufficient information for retrieval
On WhereStreet:
•
Average +6.5% improvement
•
Reason: Detailed visual clues enable effective searching
3. Limitations of Reasoning Depth
Reasoning Level | WhereCountry | WhereStreet |
Low → Medium | +1.03% | +14.0% (Bilibili), +5.9% (YouTube) |
Medium → High | -1.03% | +0.8% (minimal gain) |
•
Moderate reasoning helps, but excessive reasoning can hurt
•
o3 (high): +1.3% minimal improvement
•
GPT-5 (high): 2.51% decrease
4. Severe Regional Bias
YouTube (Europe/US) vs Bilibili (China)
Answer Accuracy: +42.7% difference
Thinking Score: +0.238 difference
Plain Text
복사
Root Causes:
•
Imbalanced training data distribution
•
Over-representation of Western content
•
Poor recognition of non-English visual clues
5. Validity of Thinking Score
•
Reweighted approach shows 13.70% higher correlation on average
•
More human-verified clues → higher accuracy
◦
1 clue: ~17.5%
◦
2 clues: ~22.5%
◦
3 clues: ~27.5%
Failure Case Analysis
Case 1: Failure to Utilize Visual Clues
•
GPT-4o overlooked tree types and fencing styles in background
•
Web search actually decreased accuracy
•
Without web search, better focus on details led to correct answer
Case 2: Overthinking
•
GLM-4.5V correctly inferred territory and coastline structure
•
But rejected correct assumption with self-contradictory reasoning
•
Too many "aha moments" led to indecision
Case 3: Incomplete Search
•
Gemini-2.5-Pro correctly identified key visual elements
•
Made reasonable assumptions
•
But limited search capabilities led to early termination
◦
Suboptimal search queries
◦
Limited search iterations
◦
Restricted retrieval context length
Limitations & Future Work
Current Limitations
1.
Performance Gap: Best model only achieves 56.32%
2.
Regional Bias: Western-centric training data problem
3.
Limited Visual Clues: Some images lack sufficient information
4.
Inconsistent Tool Usage: Web search shows inconsistent effectiveness
Future Research Directions
Build regionally balanced training datasets
Develop more sophisticated visual clue extraction methods
Improve tool usage strategies (when/how to search)
Enhance multimodal reasoning capabilities
Develop bias mitigation techniques
Key Takeaway
The benchmark reveals that state-of-the-art VLMs still struggle with:
•
Fine-grained spatial reasoning
•
Effective integration of external tools
•
Consistent performance across different geographic regions
•
Balancing reasoning depth with efficiency
What I want to discuss
I am thinking to do reproduction of PlaNet with VLMs and collecting more data
•
Problems: how to do sub-city (street-level) Location classification?
•
Current Approach: Hierarchical Geographic Classification (used in PlaNet)
The core idea is to leverage PlaNet's hierarchical spatial partitioning strategy, but replace the CNN-based image classification with VLM-based reasoning. This approach involves:
1.
Dividing geographic space into a hierarchical grid structure (similar to S2 cells or quadtree)
2.
Fine-tuning or prompting VLMs to classify images into these geographic partitions
3.
Evaluating performance at multiple granularity levels (country → city → neighborhood)
•
But, on classification, What features and keywords should be assigned to each quad?
◦
It seems that there are several methods I can use for comparing the similarity scores (e.g. Templates, Keywords based similarity calculation)
◦
for example, for every quad, make captioning that involves spatial features and I can use it to calculate similarity.
◦
Also, should it be explicit? or Implicit?
Future works
Reproduction of PlaNet replacing CNNs to VLMs
Search and Test some Sub-city (Street-level) Classification Methods
Test for Non-famous places